12-month documented case study

From $24K to $132K/mo net revenue.

One creator, twelve months of data, two distinct step-changes, documented month by month with verified earnings screenshots. All figures are net of the standard 20% platform fee.

Read this first: what this is

One creator, twelve months, documented month by month with verified screenshots. The system you'll see is the one we run: audience growth first, then monetisation and professional chat. This case study is context, not a promise. The promise is the guarantee: grow 20% in 90 days or everything we did was free.

+104.3%
Avg monthly revenue, Phase 0 → Phase 1
+93.3%
Avg monthly revenue, Phase 1 → Phase 2
+449.6%
January → December total growth
Performance breakdown

Growth came in two step-changes, each with a clear operational cause.

Systems went live at the start of March. Nothing here is a mystery spike: each jump lines up with a specific system being switched on.

Phase 0 · Jan to Feb · Before systems

Baseline

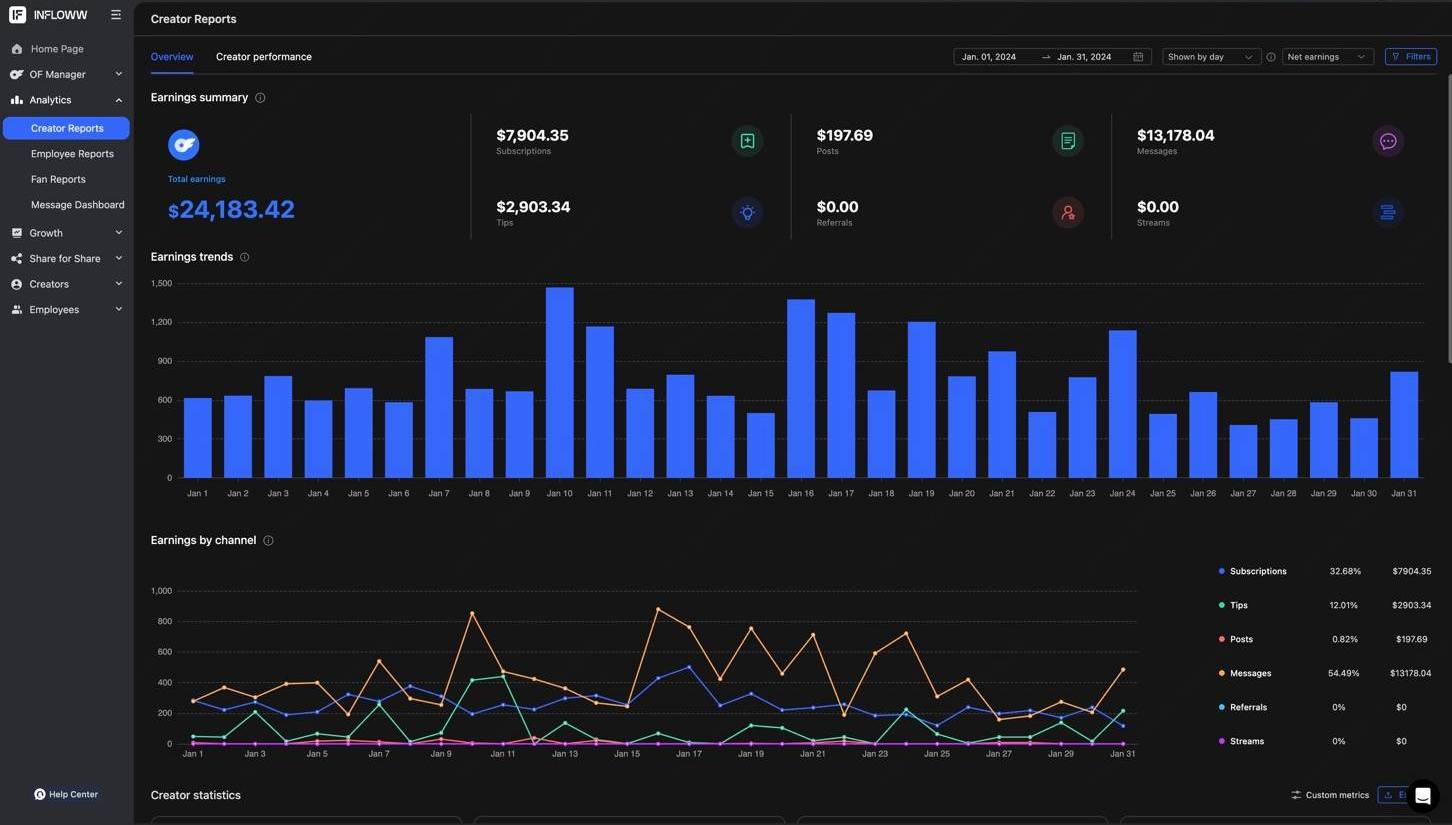
January
$24,183
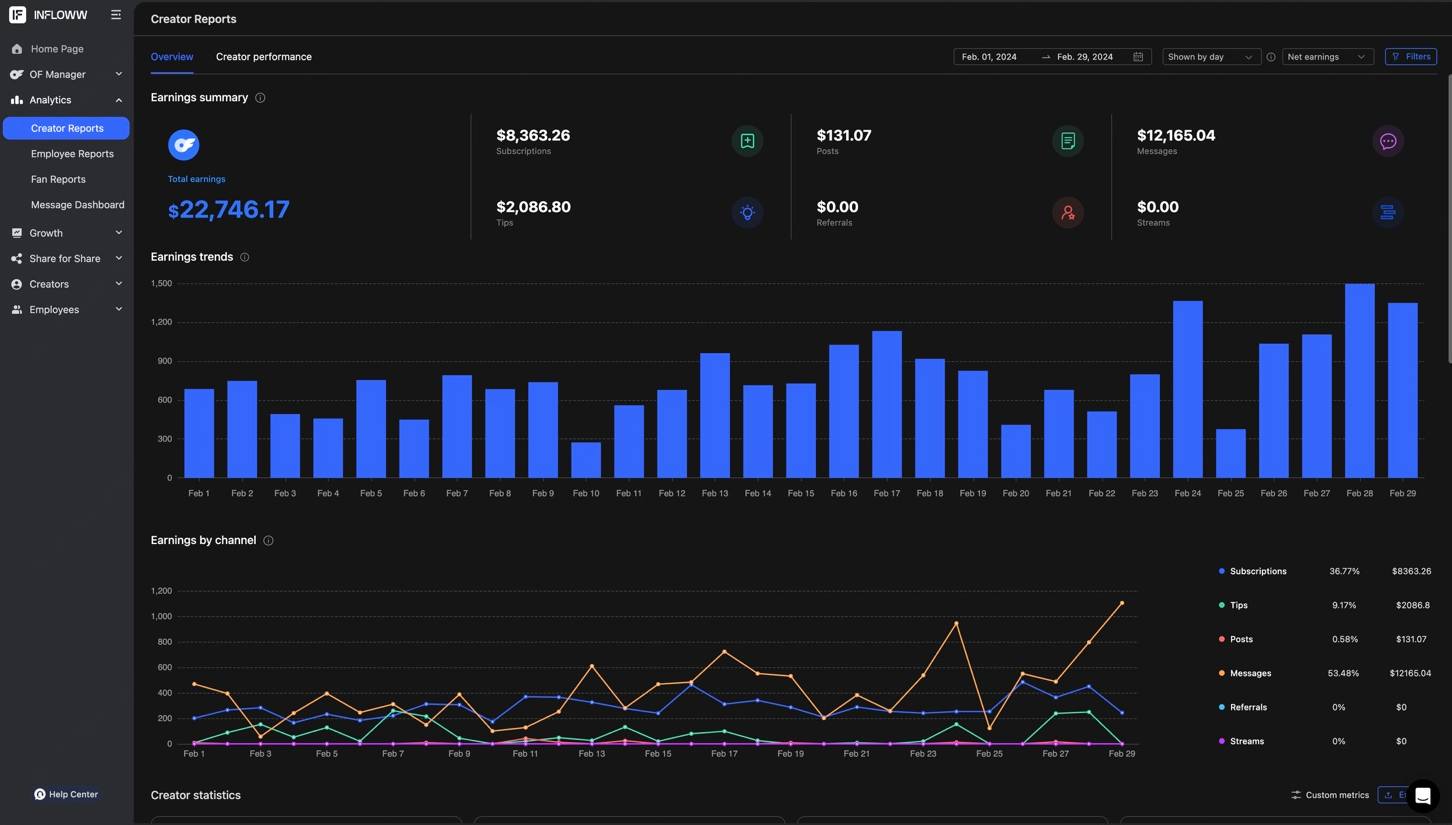
February
$22,746
The creator's performance before any structured systems: inconsistent posting, self-managed messages. This is the baseline everything below is measured against.
Phase 1 · Mar to Jun · Organic reach & audience growth

First step-change: +104% average

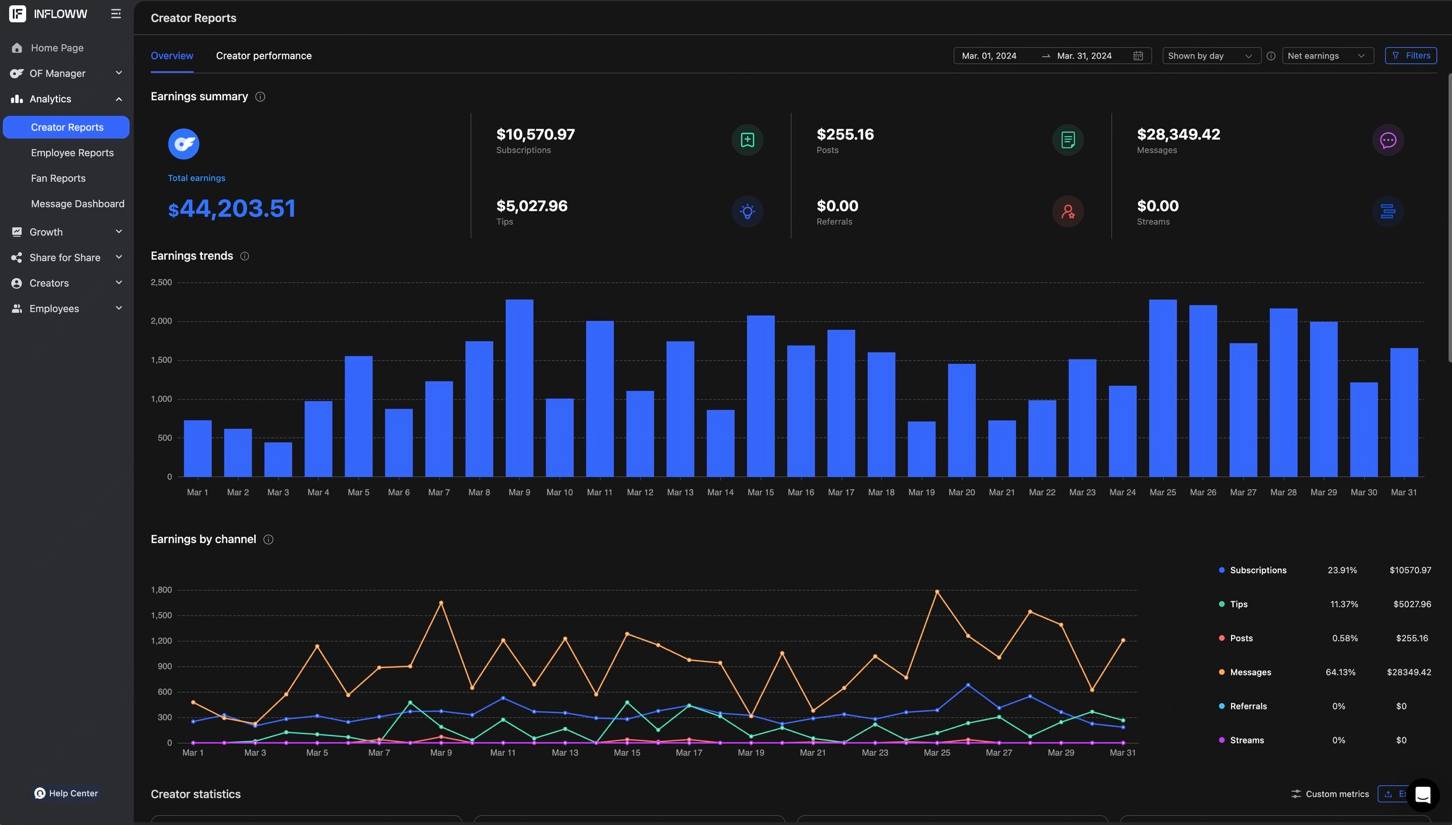
March
$44,204
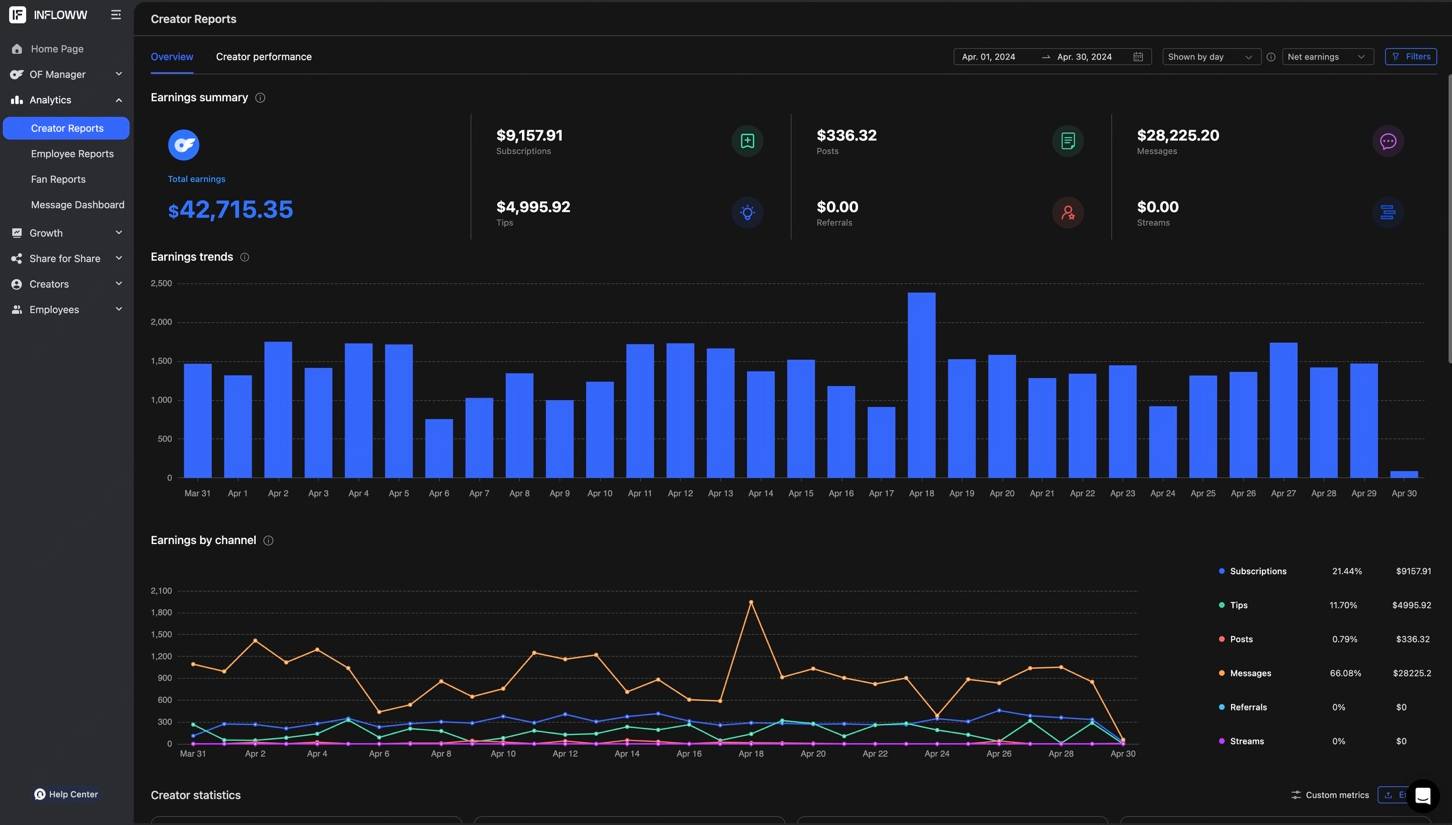
April
$42,715
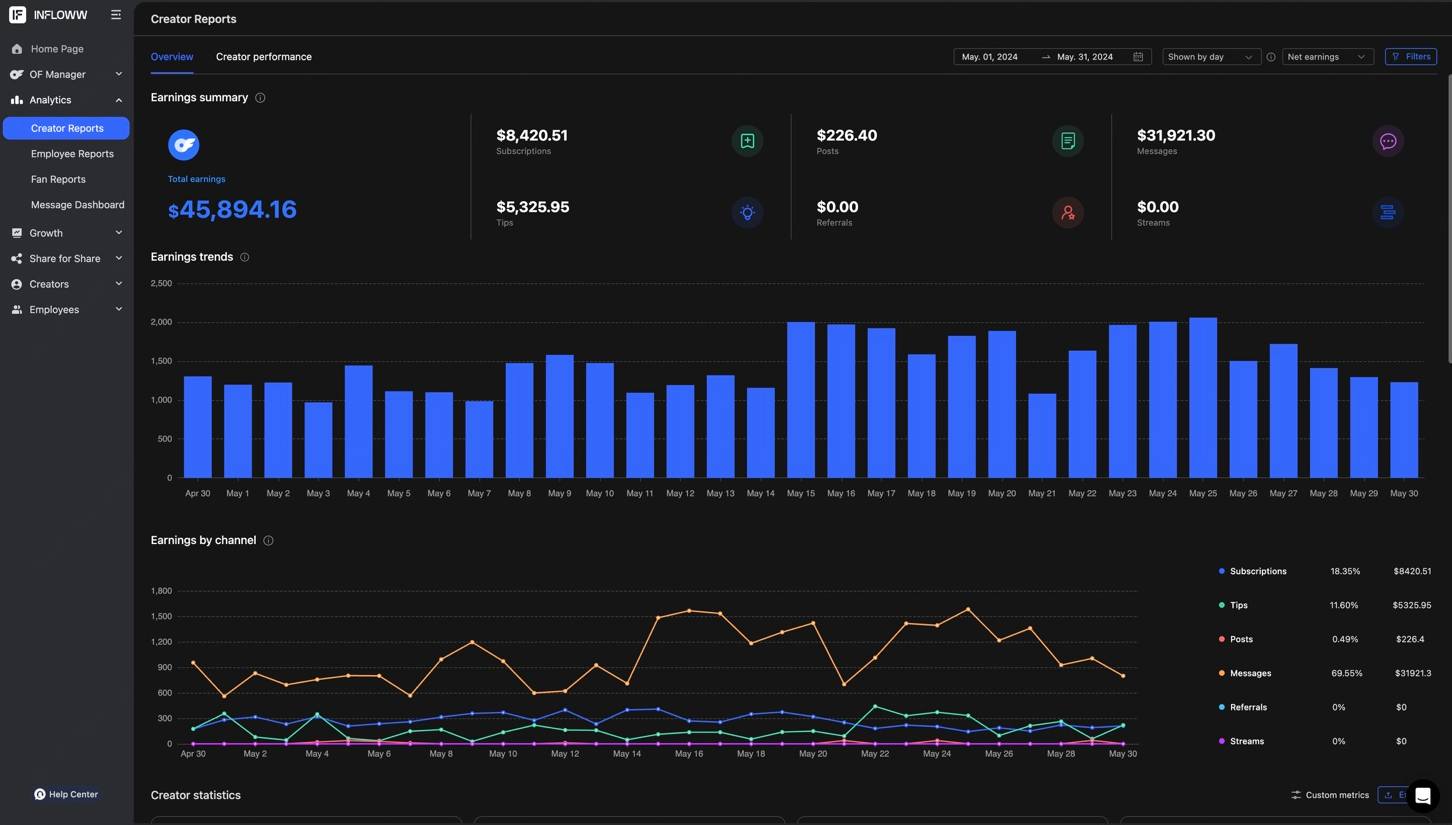
May
$45,894
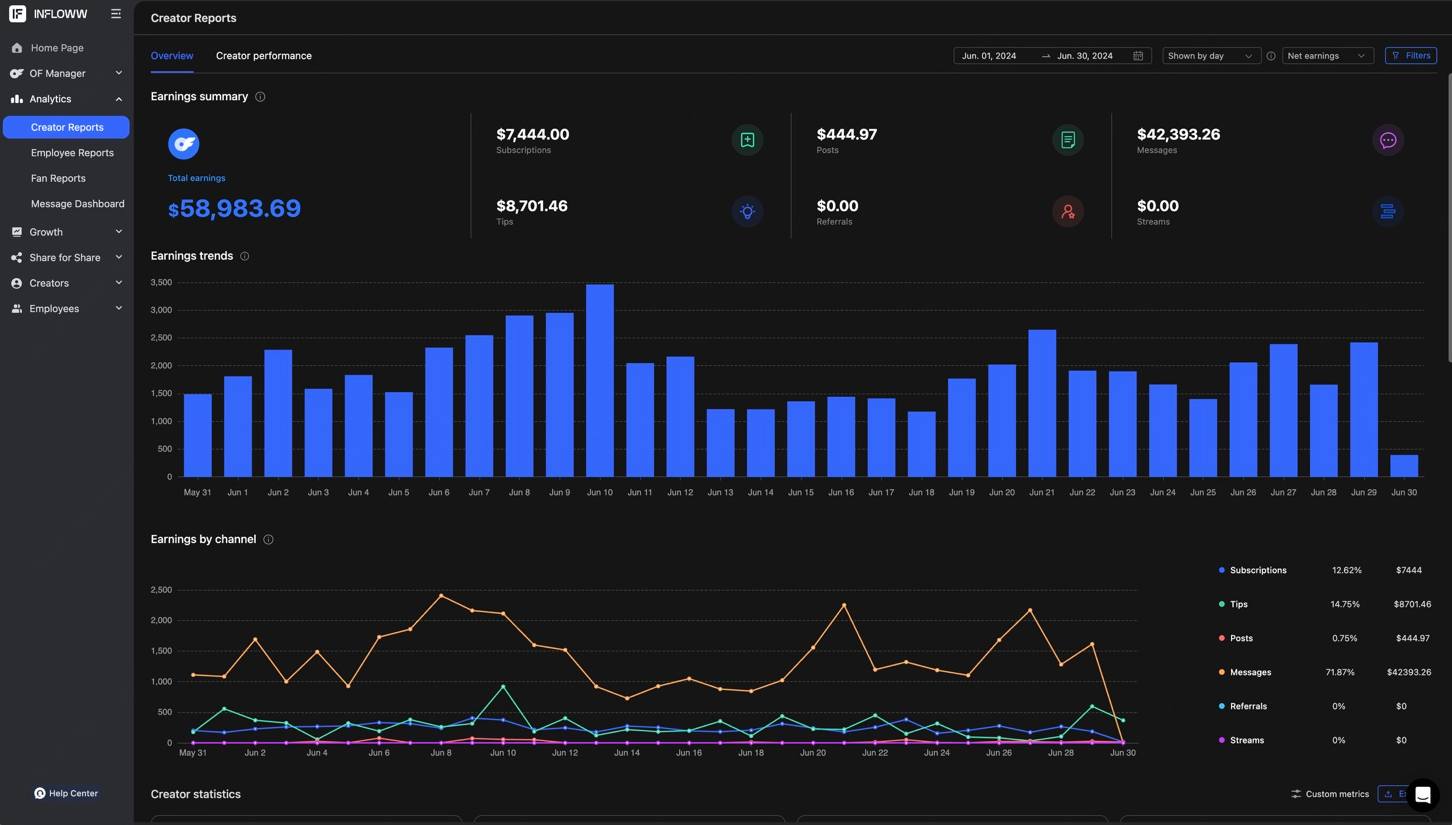
June
$58,984
The first 90 days focused entirely on audience growth: content rotation frameworks to increase reach, discoverability, and followers. Deliberately, no major monetisation or chat changes yet. This jump is traffic, not squeeze.
Phase 2 · Jul to Dec · Monetisation & conversion systems

Second step-change: +93% on top

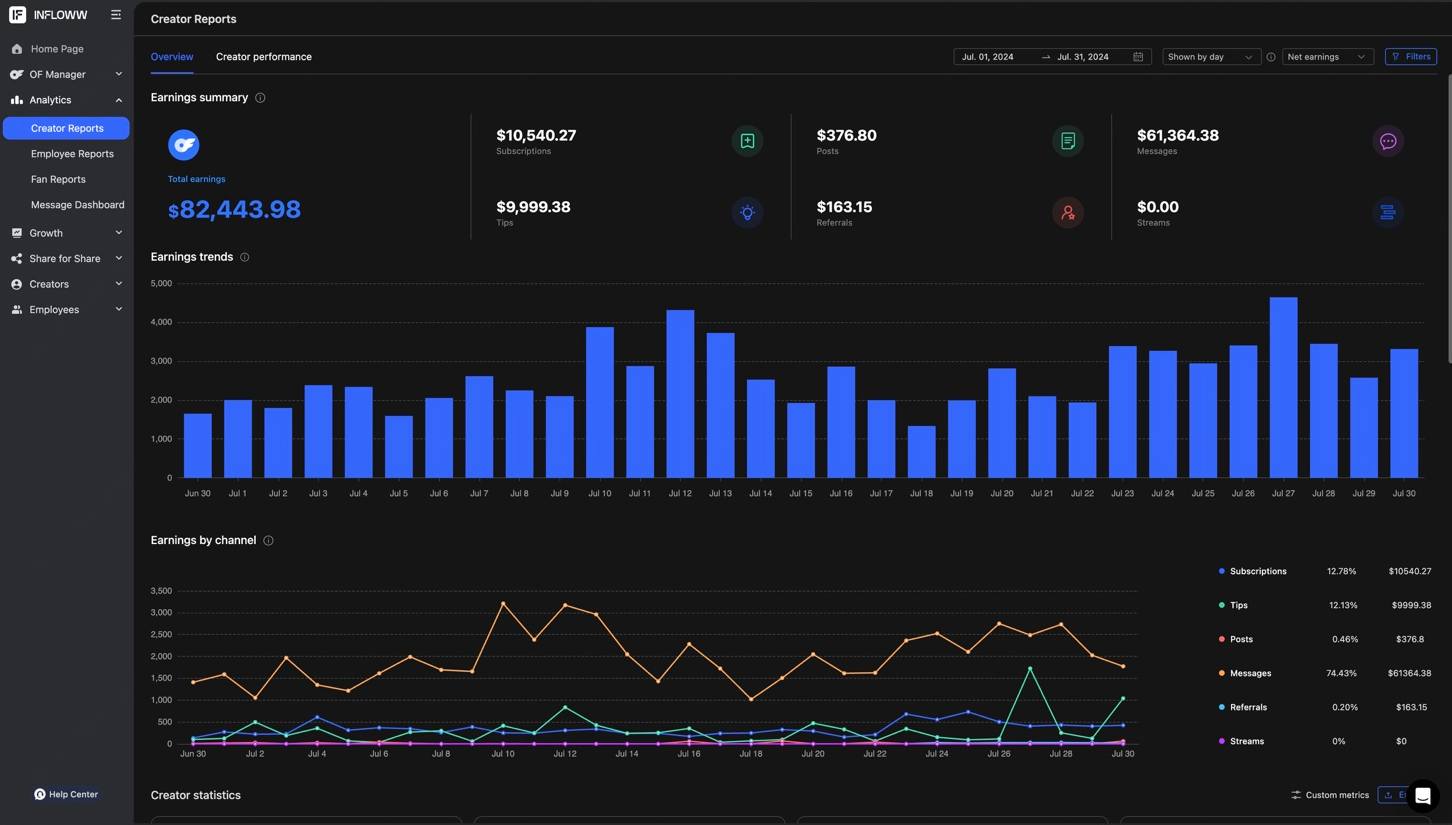
July
$82,444
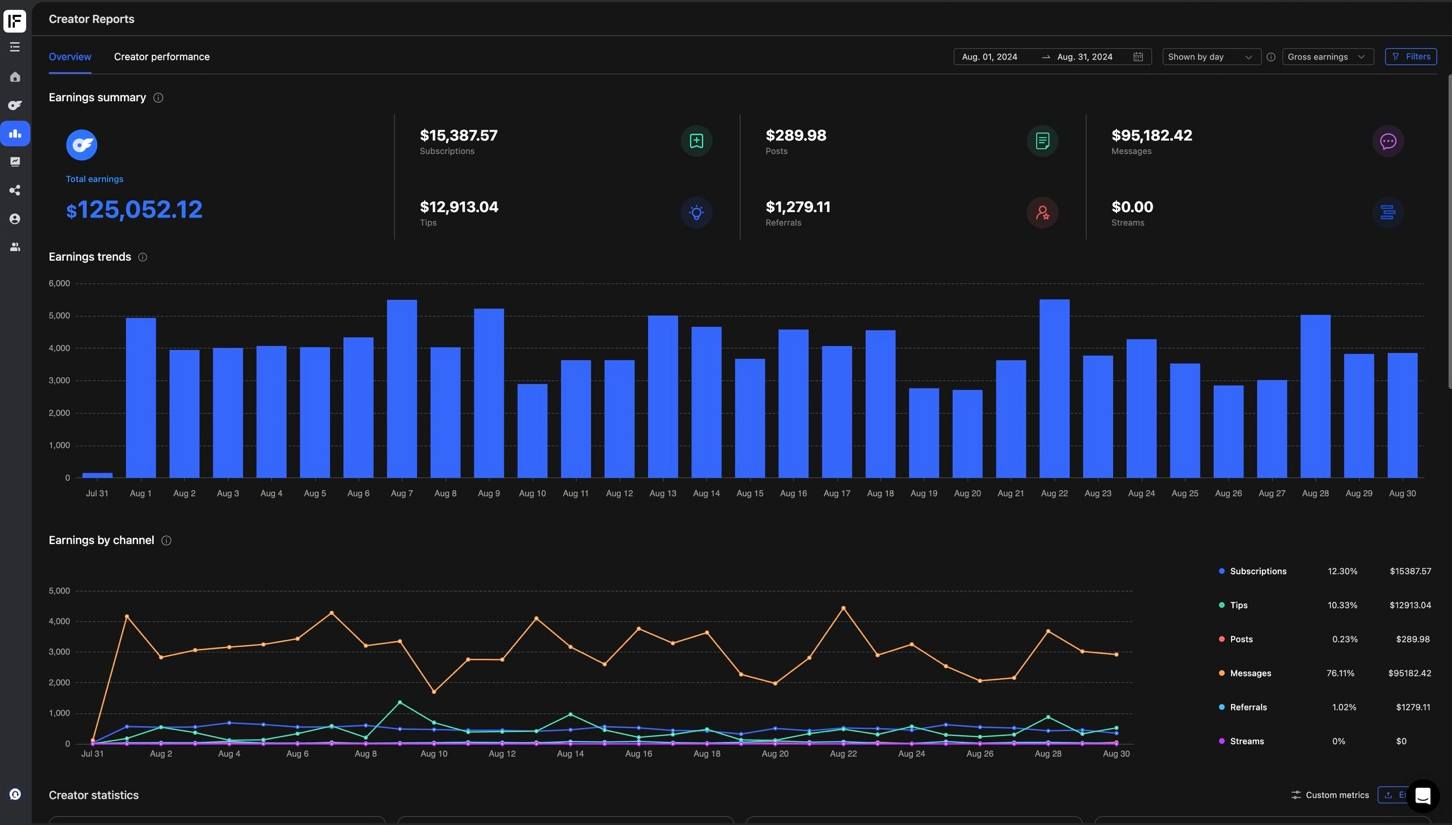
August
$100,042
September
$75,208
October
$77,211
November
$88,174
December
$132,923
Additional marketing channels to diversify traffic, in-house professional chat teams taking over messaging, and monetisation systems to lift conversion and average spend per fan. The second and larger jump was driven by conversion optimisation, not reach alone.
Month by month

The full year, no cherry-picking.

MonthPhaseNet revenueMoM
JanuaryPhase 0$24,183.42·
FebruaryPhase 0$22,746.17−5.9%
MarchPhase 1$44,203.51+94.3%
AprilPhase 1$42,715.35−3.4%
MayPhase 1$45,894.16+7.4%
JunePhase 1$58,983.69+28.5%
JulyPhase 2$82,443.98+39.8%
AugustPhase 2$100,041.70+21.3%
SeptemberPhase 2$75,208.29−24.8%
OctoberPhase 2$77,211.02+2.7%
NovemberPhase 2$88,173.90+14.2%
DecemberPhase 2$132,922.92+50.8%

Month-over-month variation is normal: September dipped 25% and the year still closed at 5.5x January. The insight isn't any single peak; it's the sustained higher baseline after each phase transition.

Where the money came from

Messages did the heavy lifting.

By December, 77% of revenue came through messages; subscriptions were 14%. That mix is the norm on well-run accounts, and it's why chat is the single highest-leverage function an agency runs.

The single biggest multiplier: professional chat handling

The most significant revenue multiplier across the year was the transition to in-house professional chat teams. Better response timing, better conversation flow, and monetisation opportunities captured without requiring a single piece of additional content from the creator. Creators who run their own messages undervalue their time and respond inconsistently. Professional handling turns every conversation into a revenue opportunity.

Verified performance

Twelve months of receipts.

Monthly earnings dashboards for the full year, cropped only to remove account-identifying details. Nothing else is altered.

January earnings dashboard
January · baseline
February earnings dashboard
February · baseline
March earnings dashboard
March · systems live, Phase 1 begins
April earnings dashboard
April
May earnings dashboard
May
June earnings dashboard
June
July earnings dashboard
July · Phase 2 begins
August earnings dashboard
August · first $100K month
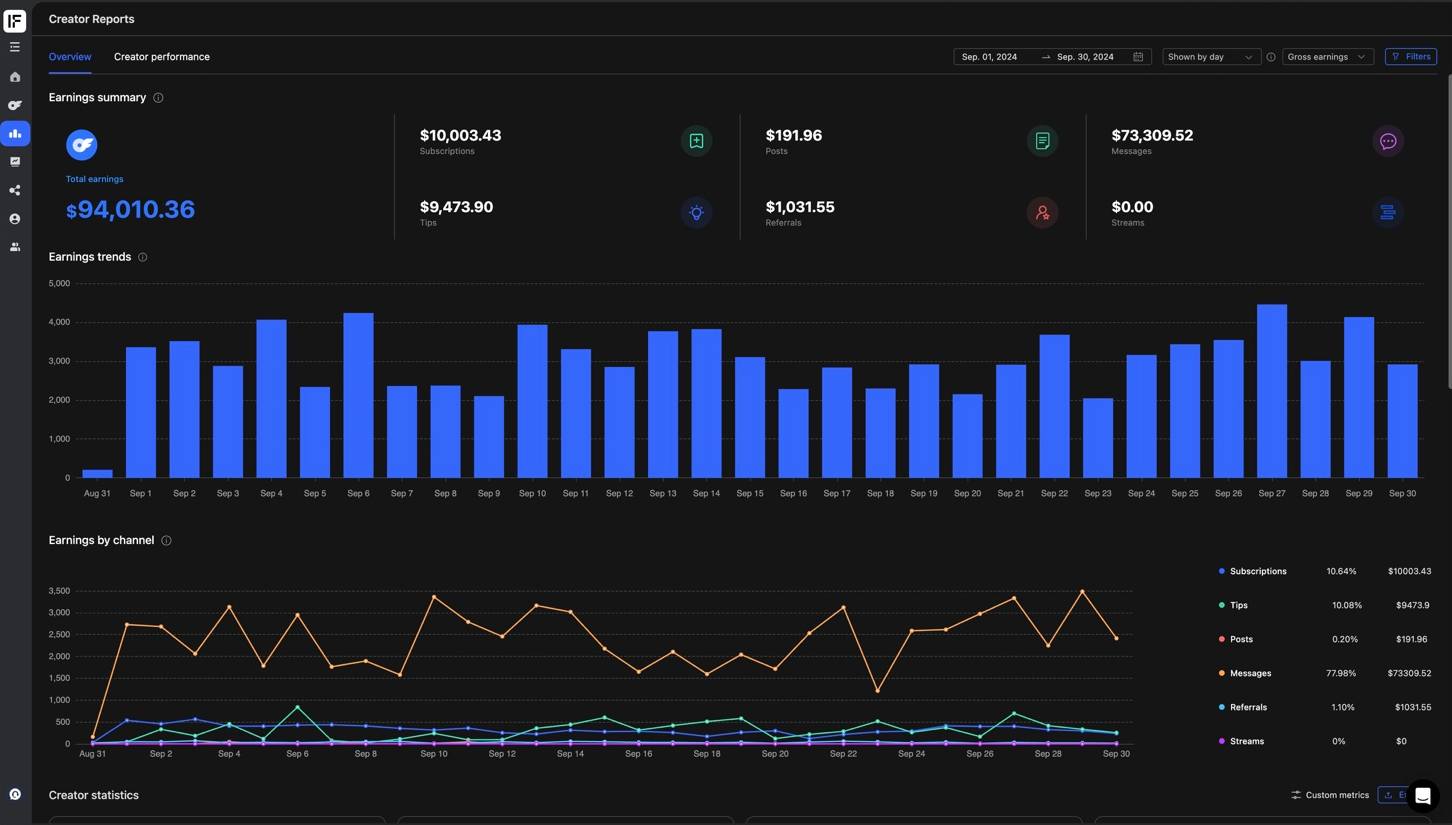
September earnings dashboard
September
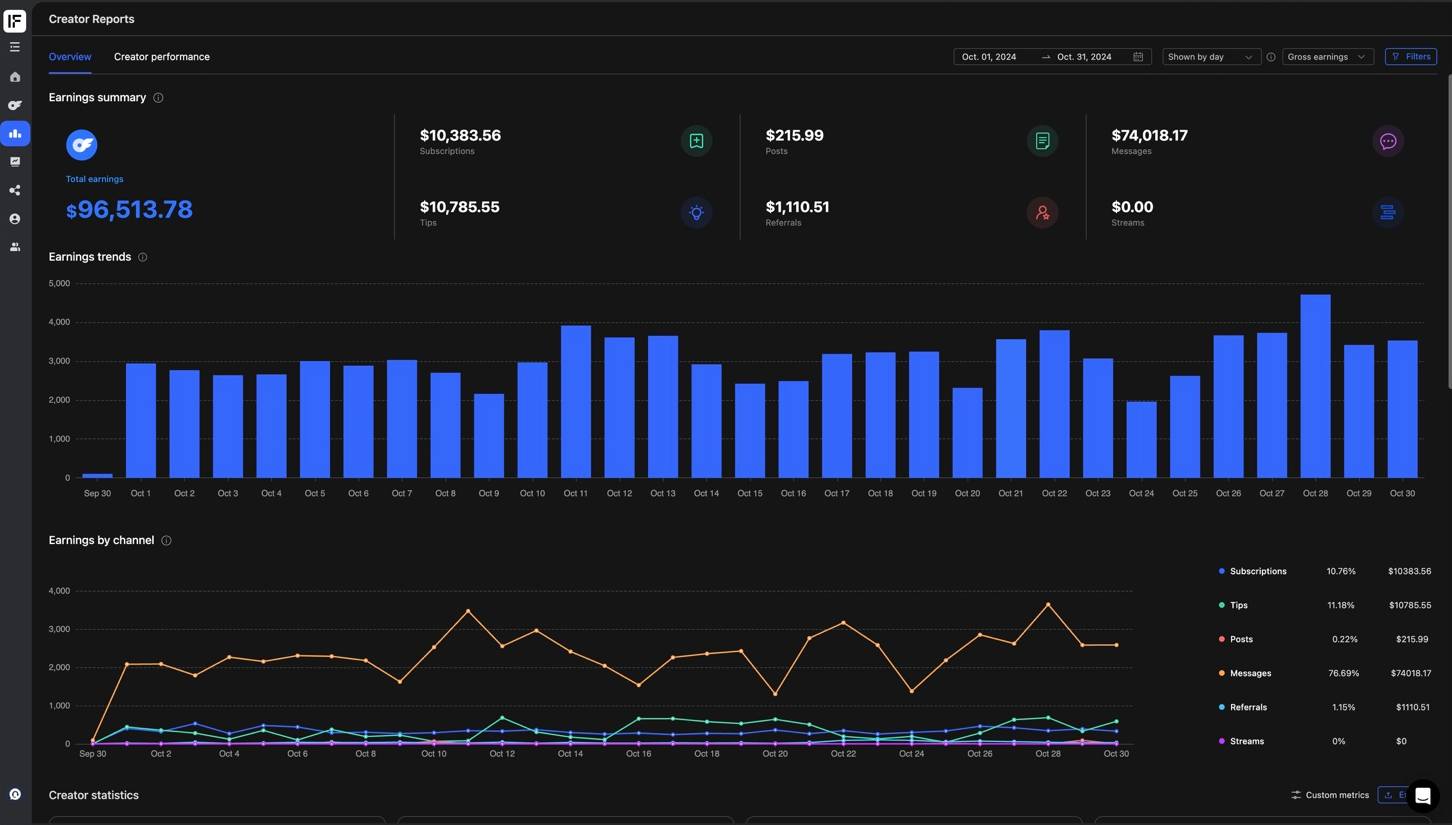
October earnings dashboard
October
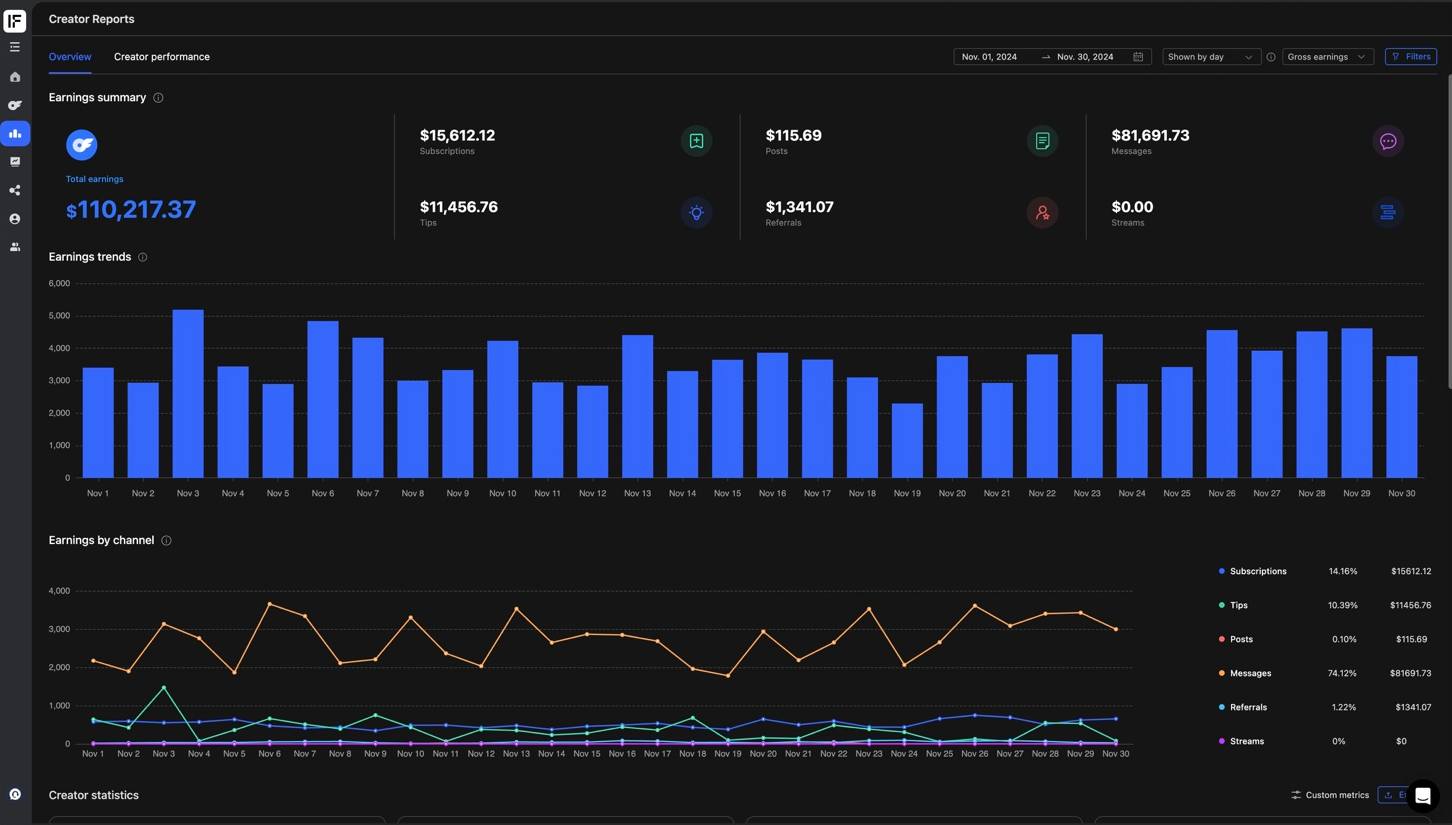
November earnings dashboard
November
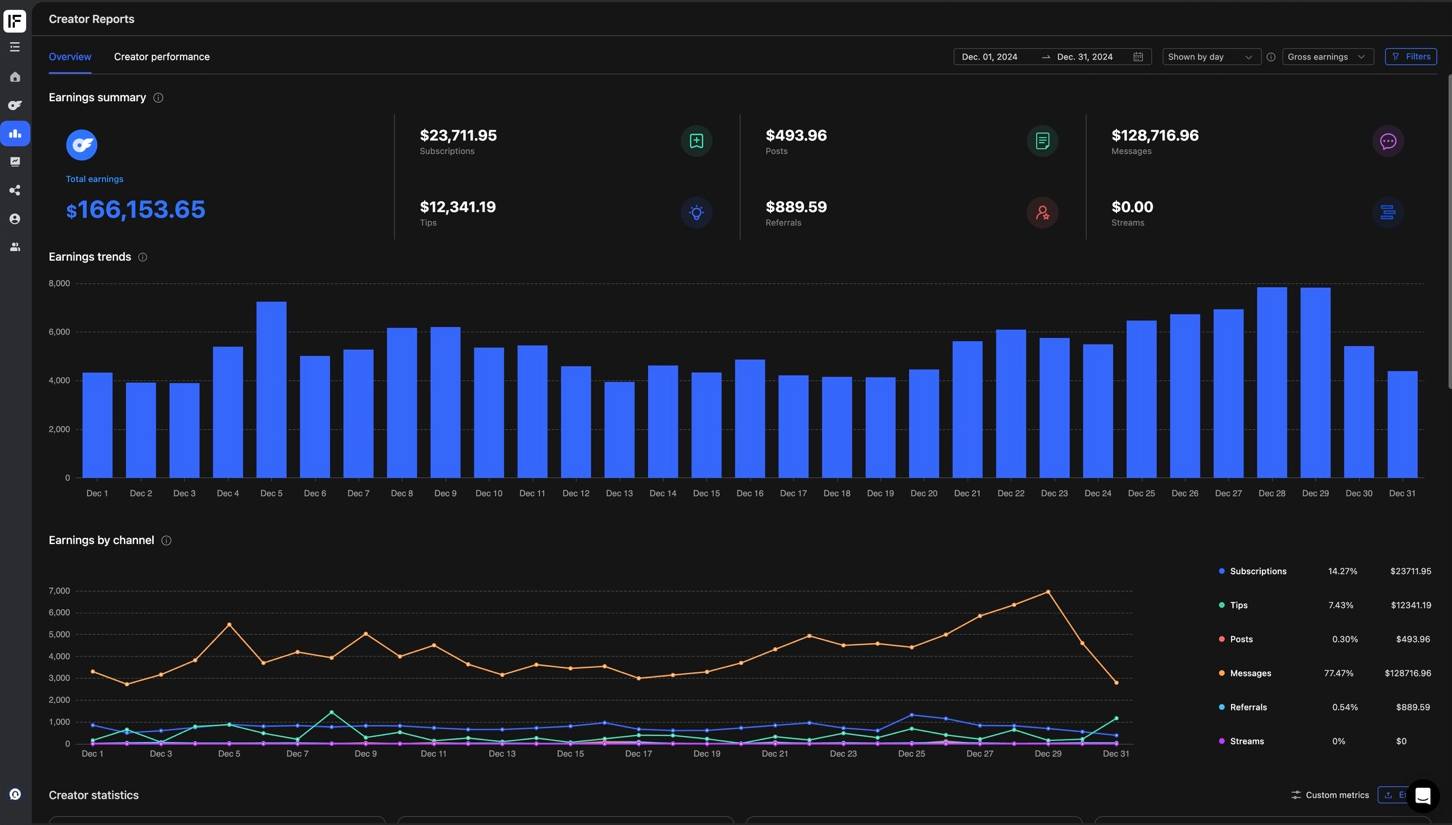
December earnings dashboard
December · $132,922.92 net

Dashboard views may display gross or net totals depending on the filter visible in each screenshot. All figures quoted on this page are net of the standard 20% platform fee: December shows $166,153.65 gross, which is $132,922.92 net. The math is there to check.

Compliance & transparency

The context that keeps this honest.

Real, but anonymised

All data is from a real managed account. Creator identity has been anonymised to protect privacy.

Platform fees accounted

All quoted figures are net revenue after the standard 20% platform fee deduction.

Outcomes vary

Results depend on many factors including content quality, consistency, niche, and market conditions. One account is one account.

This isn't the promise

This case study is history, not a guarantee of your results. The actual promise is contractual: +20% in 90 days or everything we did was free.

Limited monthly onboarding

The system is repeatable. Your page is next.

Apply Now

$10k+/month alt creators only · 18+ · takes 3 minutes